The ocean is not a blank space. It is a tightly regulated industrial zone. At any given moment, there are over 50,000 merchant ships traversing the high seas, carrying everything from crude oil to iPhones.
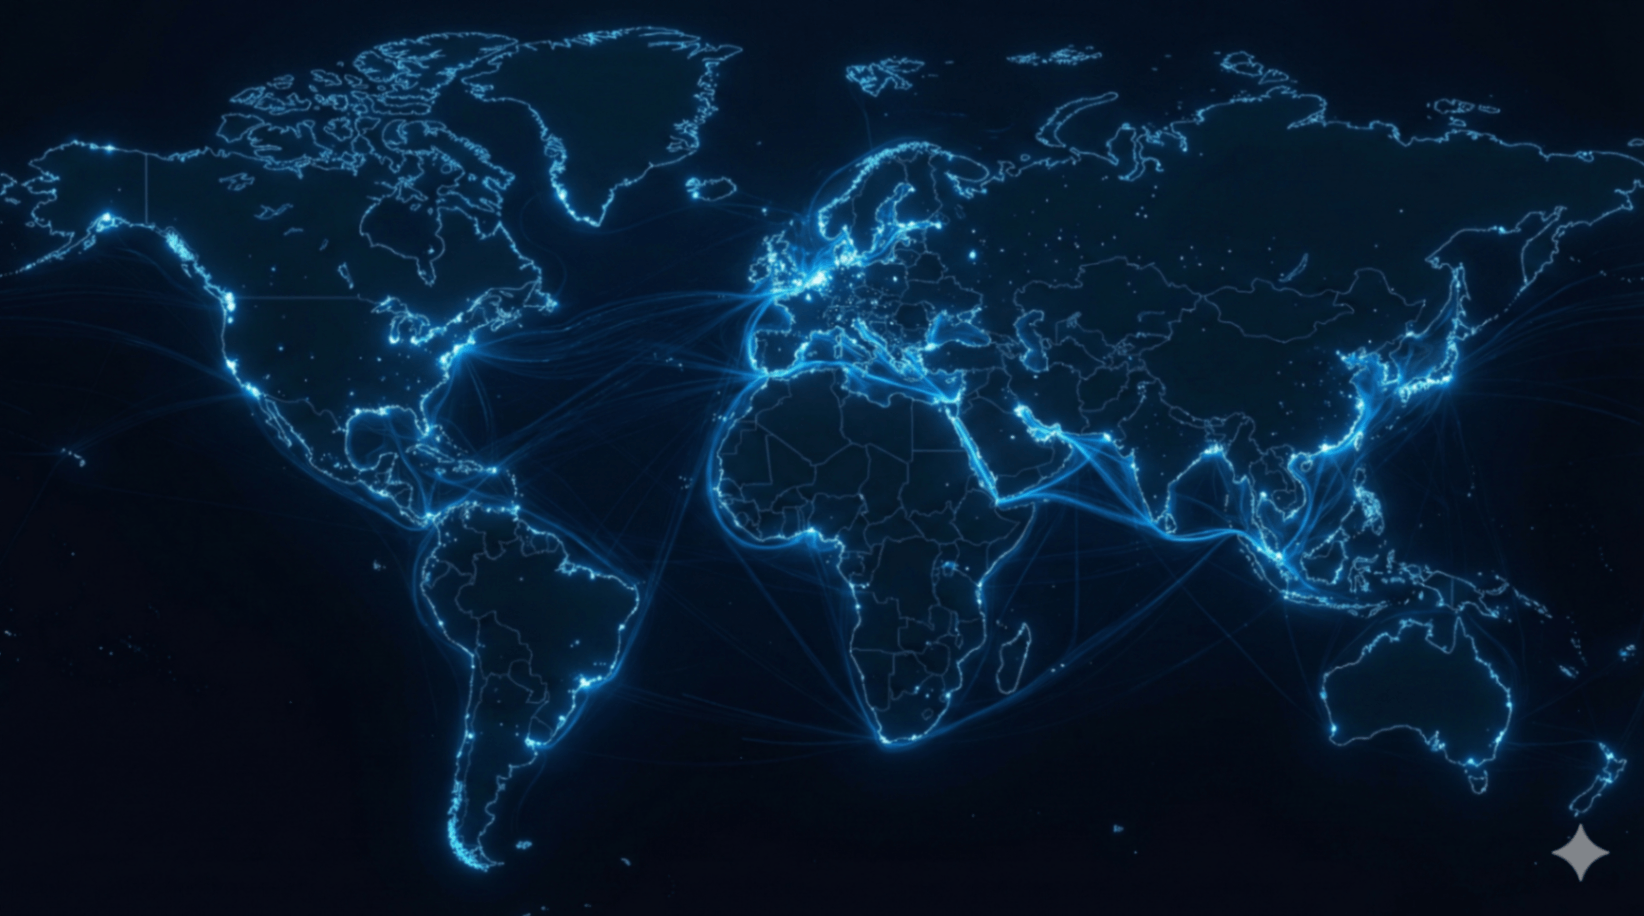
The map above visualizes one year of GPS transponder data from these vessels. It reveals that global trade does not wander; it follows precise, narrow corridors dictated by currents, fuel efficiency, and political stability. These are the Sea Lines of Communication (SLOCs)—the arteries that keep the global economy supplied with food, fuel and manufactured goods.
The Hidden Skeleton of the Economy
When economists talk about "supply chains," this is what they mean in physical form:
- Bulk carriers hauling ore and grain from a handful of resource-exporting ports.
- Container ships moving finished goods between East Asian factories and Western consumers.
- Tanker fleets transporting oil and gas along a few highly exposed chokepoints.
In The World Pulse, this map is your maritime layer: it shows where the physical backbone of globalization is most concentrated—and therefore most fragile.
Logistics Readout
11 Billion Tons
Raw materials, food, manufactured goods.
$14 Trillion USD
~60% of world merchandise trade by value.
Strait of Malacca
A few dozen kilometers wide, feeding East Asia.
The Choke Points
The vulnerability of the modern world is visible on this map. Notice how the chaotic web of the open ocean funnels into tiny, dangerous bottlenecks: the Suez Canal, the Panama Canal, the Strait of Hormuz and the Bab-el-Mandeb.
A single ship stuck in the Suez Canal (like the Ever Given in 2021) can freeze 12% of global trade instantly. A tanker incident in the Strait of Hormuz can disrupt a fifth of the world’s oil supply. This map is not just about economics; it is the primary blueprint for naval warfare strategy and sanctions policy.
Strategic Chokepoint Briefing
Connects Europe and Asia. Narrow, man-made, and extremely shallow relative to ship size.
Shortens Atlantic–Pacific routes. Capacity limits force some mega-ships around Cape Horn.
Energy and container lifelines. Any disruption ripples through prices within days.
In World Pulse missions, these pinch-points appear as impossibly bright knots on an otherwise thin web. Your task: recognize them in seconds—even when labels and coastlines are removed.
The Identity Challenge
In the World Pulse Game, this map is commonly confused with the submarine cable dataset. Both show lines criss-crossing oceans. But they describe different layers of globalization.
How to tell them apart:
- Port Hubs vs. Landing Stations: Shipping routes converge on ports like Shanghai, Rotterdam and Singapore. Cable maps converge on fewer, highly specialized landing facilities.
- Polar Behavior: Cables cut clean diagonals across deep water. Shipping lanes hug coasts, avoid storms and follow currents.
- Canal Highlights: Suez and Panama appear as intense bottlenecks on shipping maps, but are far less pronounced on cable maps.
"Data teleports. Cargo does not. The shape of this map is a reminder that atoms still obey geography."
Learning to distinguish these patterns is part of the cognitive training: the same ocean, two completely different nervous systems—one for physical goods, one for information.
Identify The Pattern
Most people confuse this map with Submarine Cables or Ocean Currents. Can you distinguish physical cargo paths from digital data paths when all labels are stripped away?
Inside the World Pulse missions, this map appears alongside population, cables and night lights. Your score is not just speed—it is how accurately you read what the lines actually represent.
Continue the Briefing
Treat this as your maritime dossier, then link it with the other layers of globalization: data, ports and coastal infrastructure.
The Glass Ocean
Compare physical shipping lanes with the invisible fiber cables laid along similar routes.
Coastal Lighthouses
Zoom into the coastal infrastructure that keeps these routes alive and ships off the rocks.
World Pulse: Trade Routes
Enter the live geospatial test where shipping lanes are just one of many layers to decode.